All guides
Read your analytics
See how your posts are doing on Facebook, Instagram, YouTube and LinkedIn: likes, comments, shares, followers, views, your best posts and the best time to post. This guide explains what every number and chart means.
Before you start
- ✓At least one account connected (Facebook Page, Instagram, YouTube or LinkedIn)
1. Open Analytics and pick what to look at
Tap Analytics in the menu. Some numbers are read live from each platform every time you open the page; the cards, the chart and the best time to post come from numbers SlideoClip saves once a day. Nothing is guessed: if a platform doesn't give us a number, you see — with the reason.
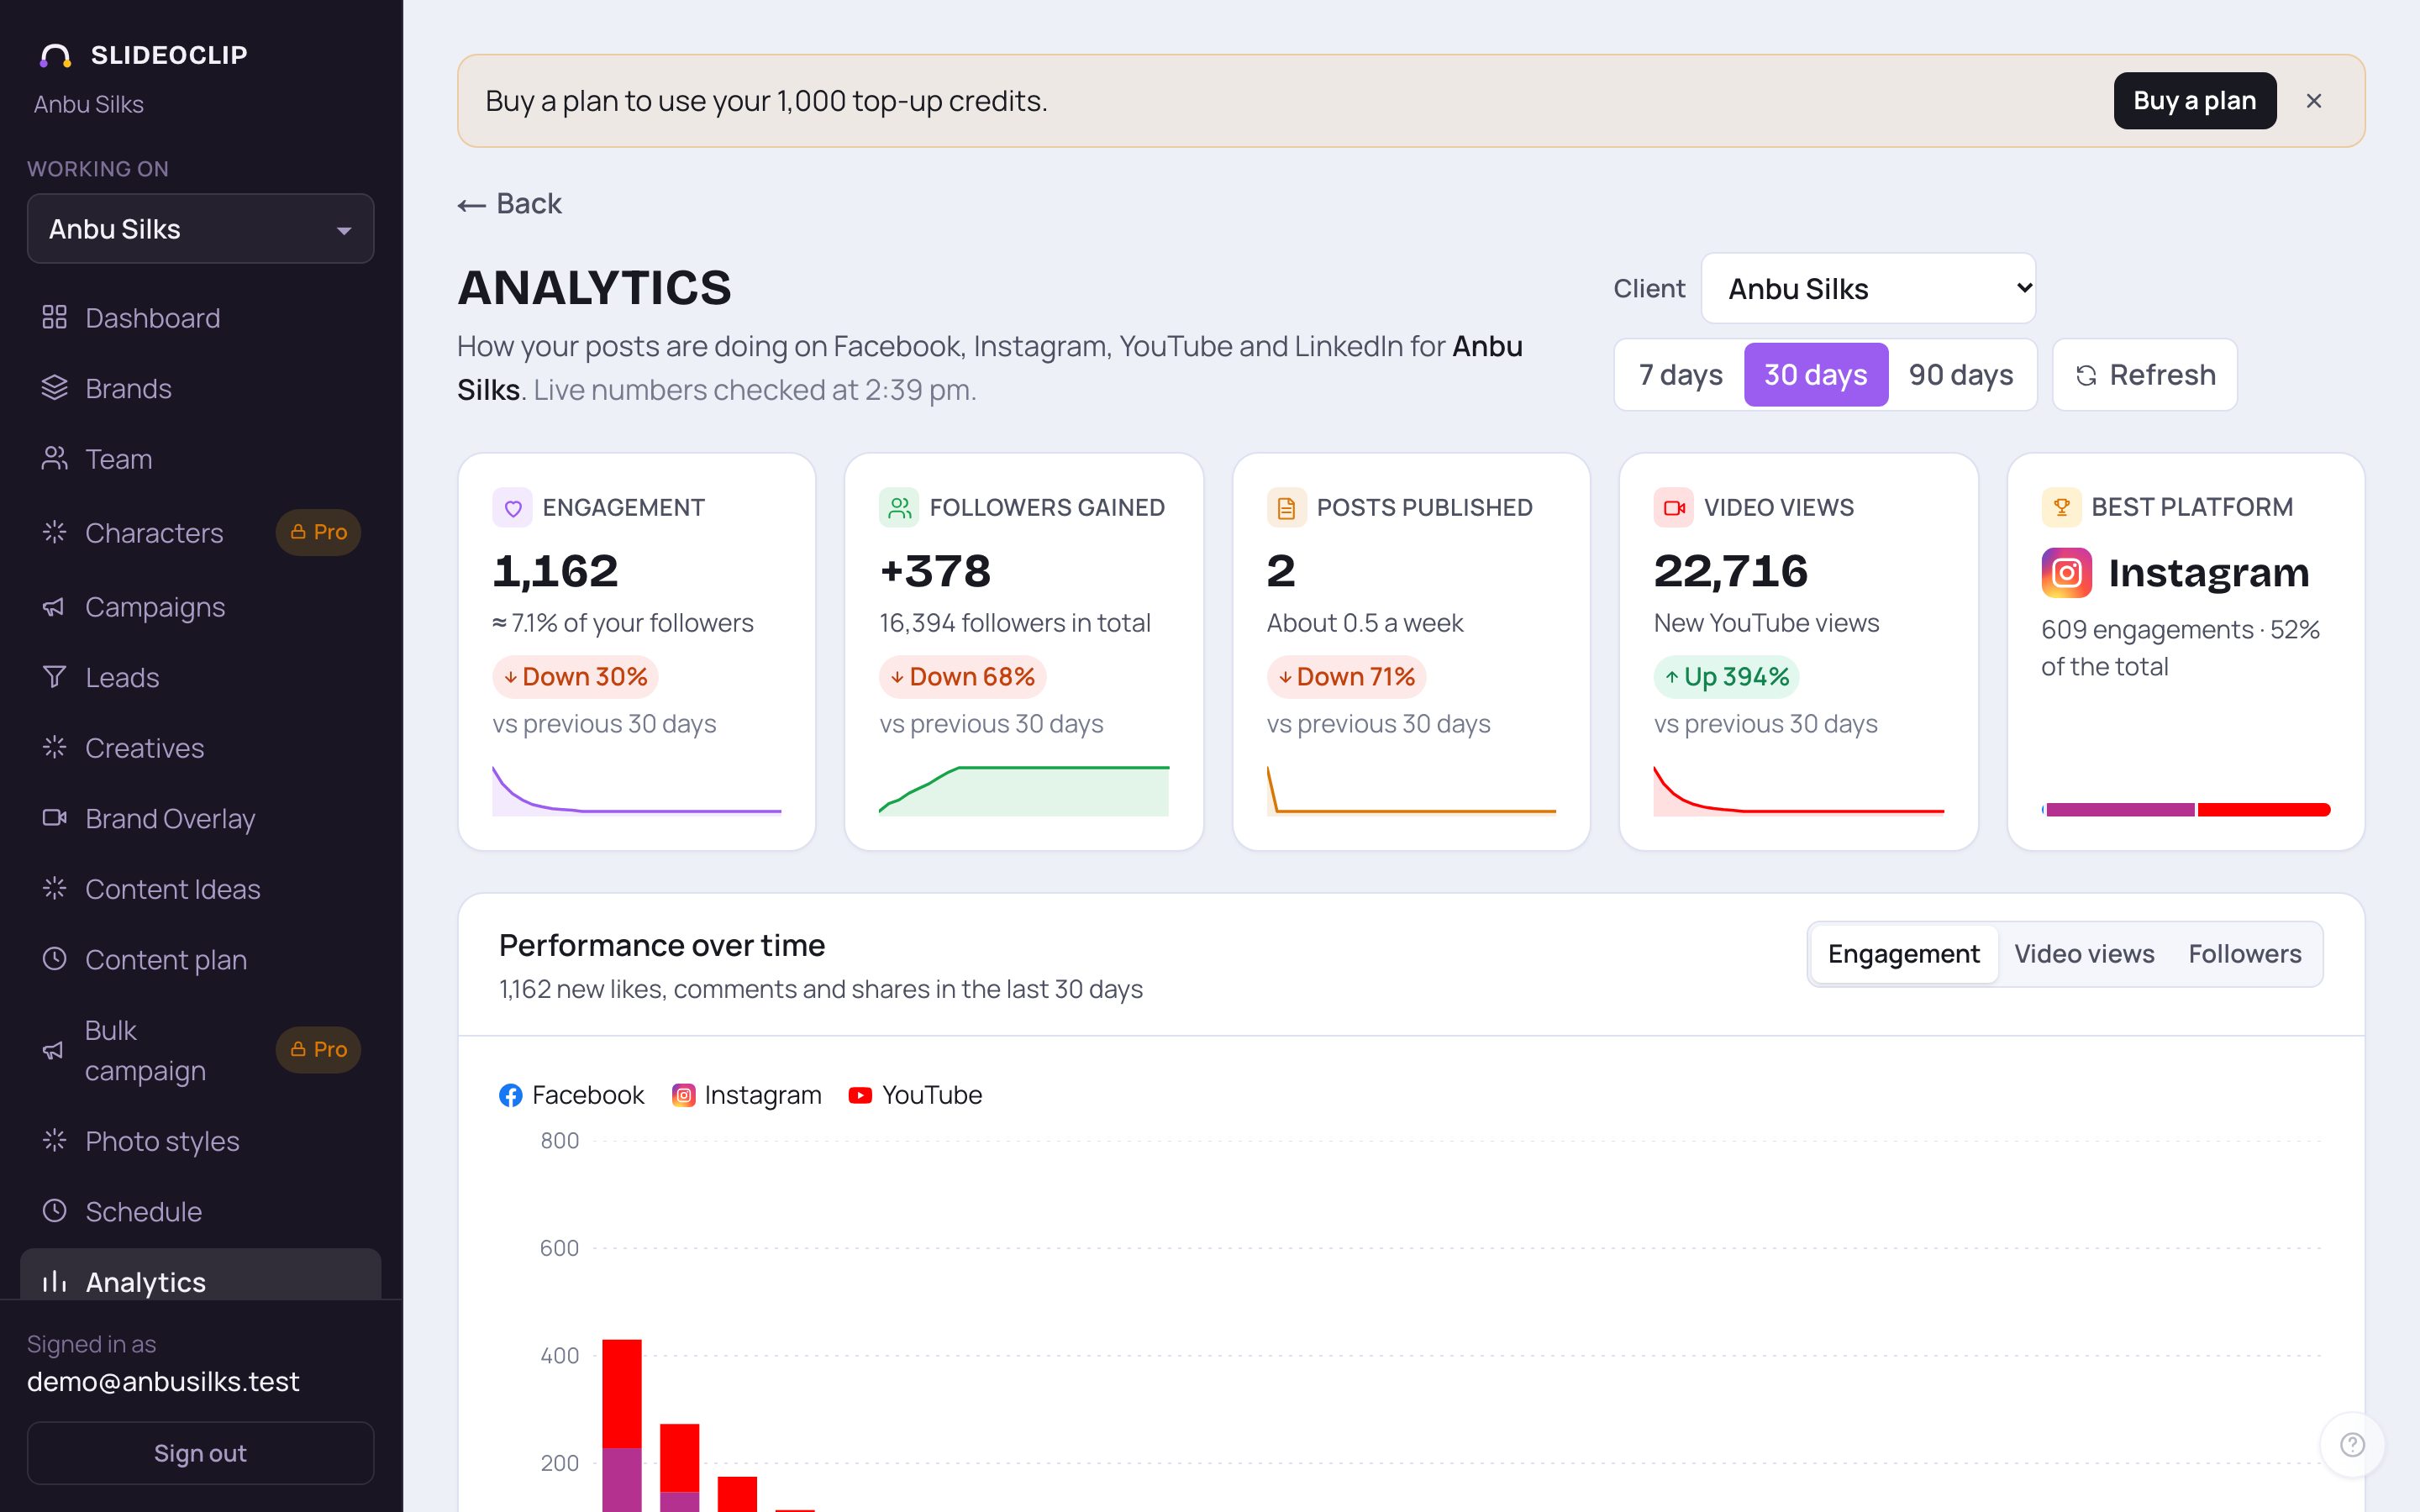
- 1Pick a client, or All clients to add up every account. The page shows the accounts tagged to that client.
- 2Pick the period: 7 days, 30 days or 90 days. Every number below is for that period, compared with the same number of days just before it.
- 3Tap Refresh to read the latest numbers again. The line under the title says when the live numbers were last checked.
2. The headline numbers
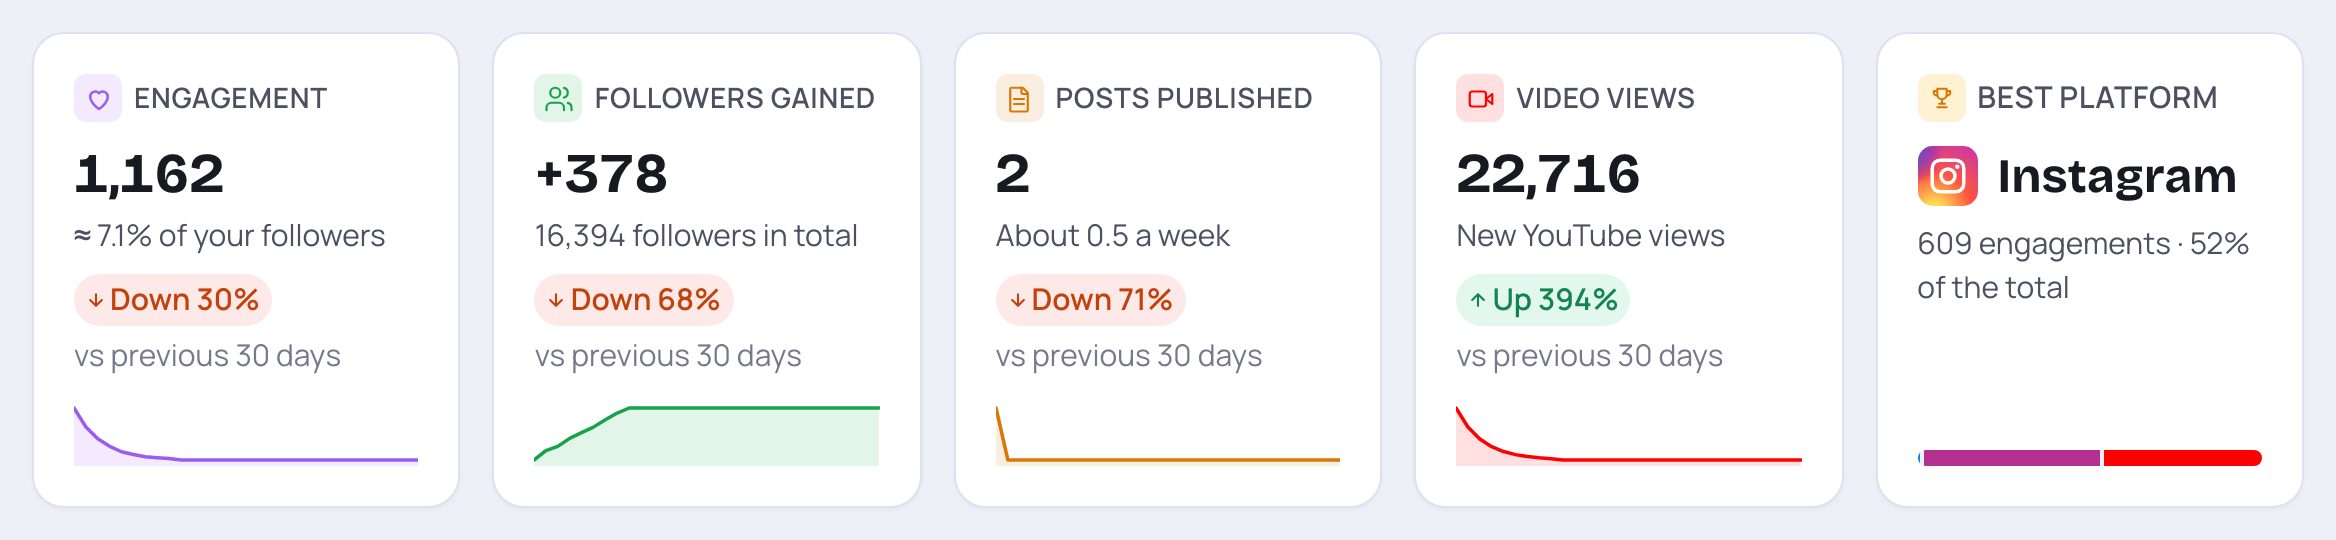
- 1Engagement: new likes, comments and shares your posts got in this period. Under it, roughly what share of your followers that is.
- 2Followers gained: new followers and subscribers across your accounts, minus anyone who left. It needs two days of saved counts before it shows.
- 3Video views: new views on your YouTube videos. Facebook and Instagram views aren't shown yet, because SlideoClip doesn't have Meta's permission to read them.
- 4Best platform: where your posts got the most engagement, and its share of the total. The coloured bar splits the engagement by platform.
- Posts published: posts that went out on your connected accounts in this period, and about how many a week.
- Under each number, Up or Down with a percentage compares it with the period before. The small line at the bottom of each card is that number day by day. Hover over a card's name to read what it means.
3. The chart: performance over time
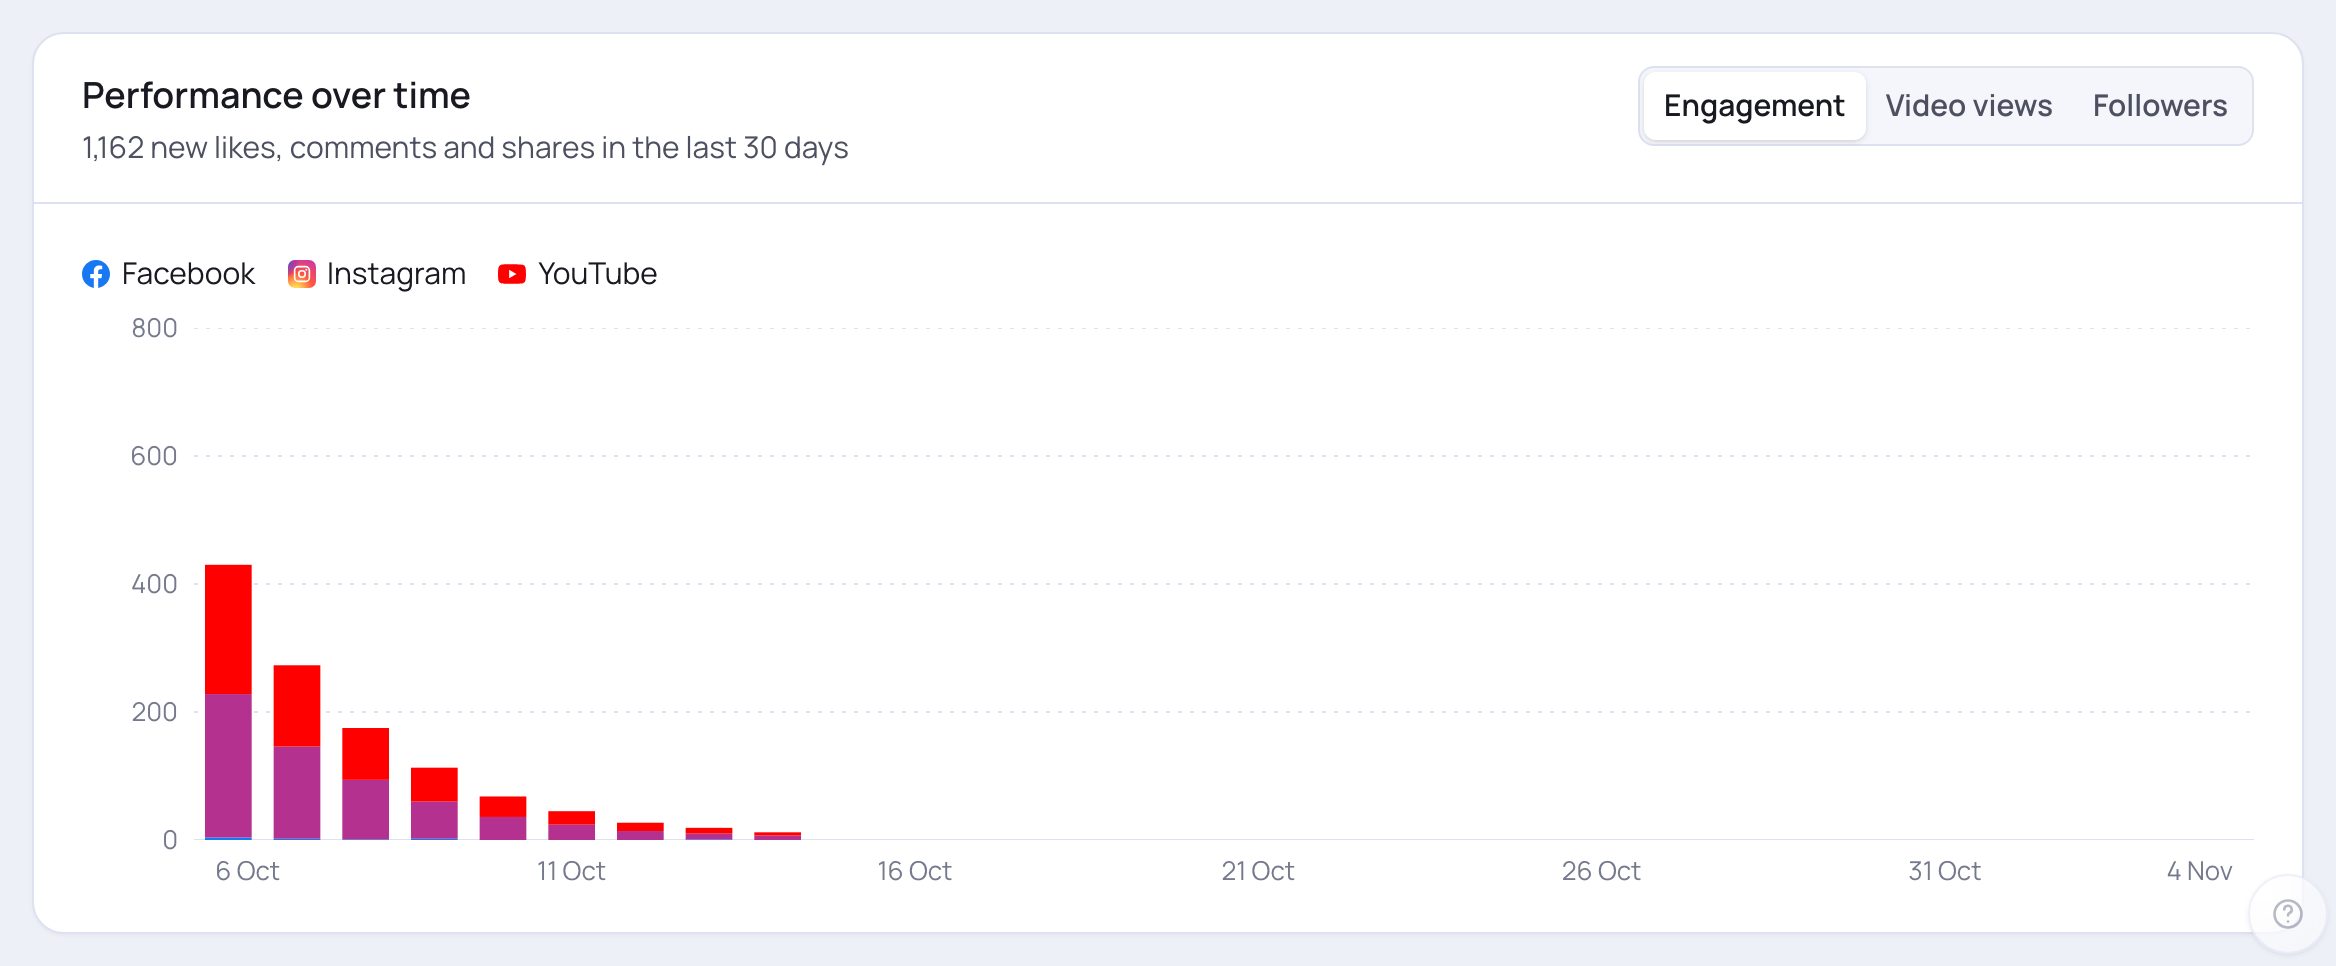
- 1The chart shows one bar or point per day for the period you picked. The line under the title adds it all up, for example how many new likes, comments and shares.
- 2Switch what the chart shows: Engagement (stacked by platform), Video views (YouTube) or Followers (one line per account).
- 3The key shows which colour is which platform or account. Hover over (or tap) a day to read its exact numbers.
💡 Just connected? The chart says Your history starts building today. SlideoClip saves each account's numbers once a day, so come back in a few days.
4. Each platform at a glance
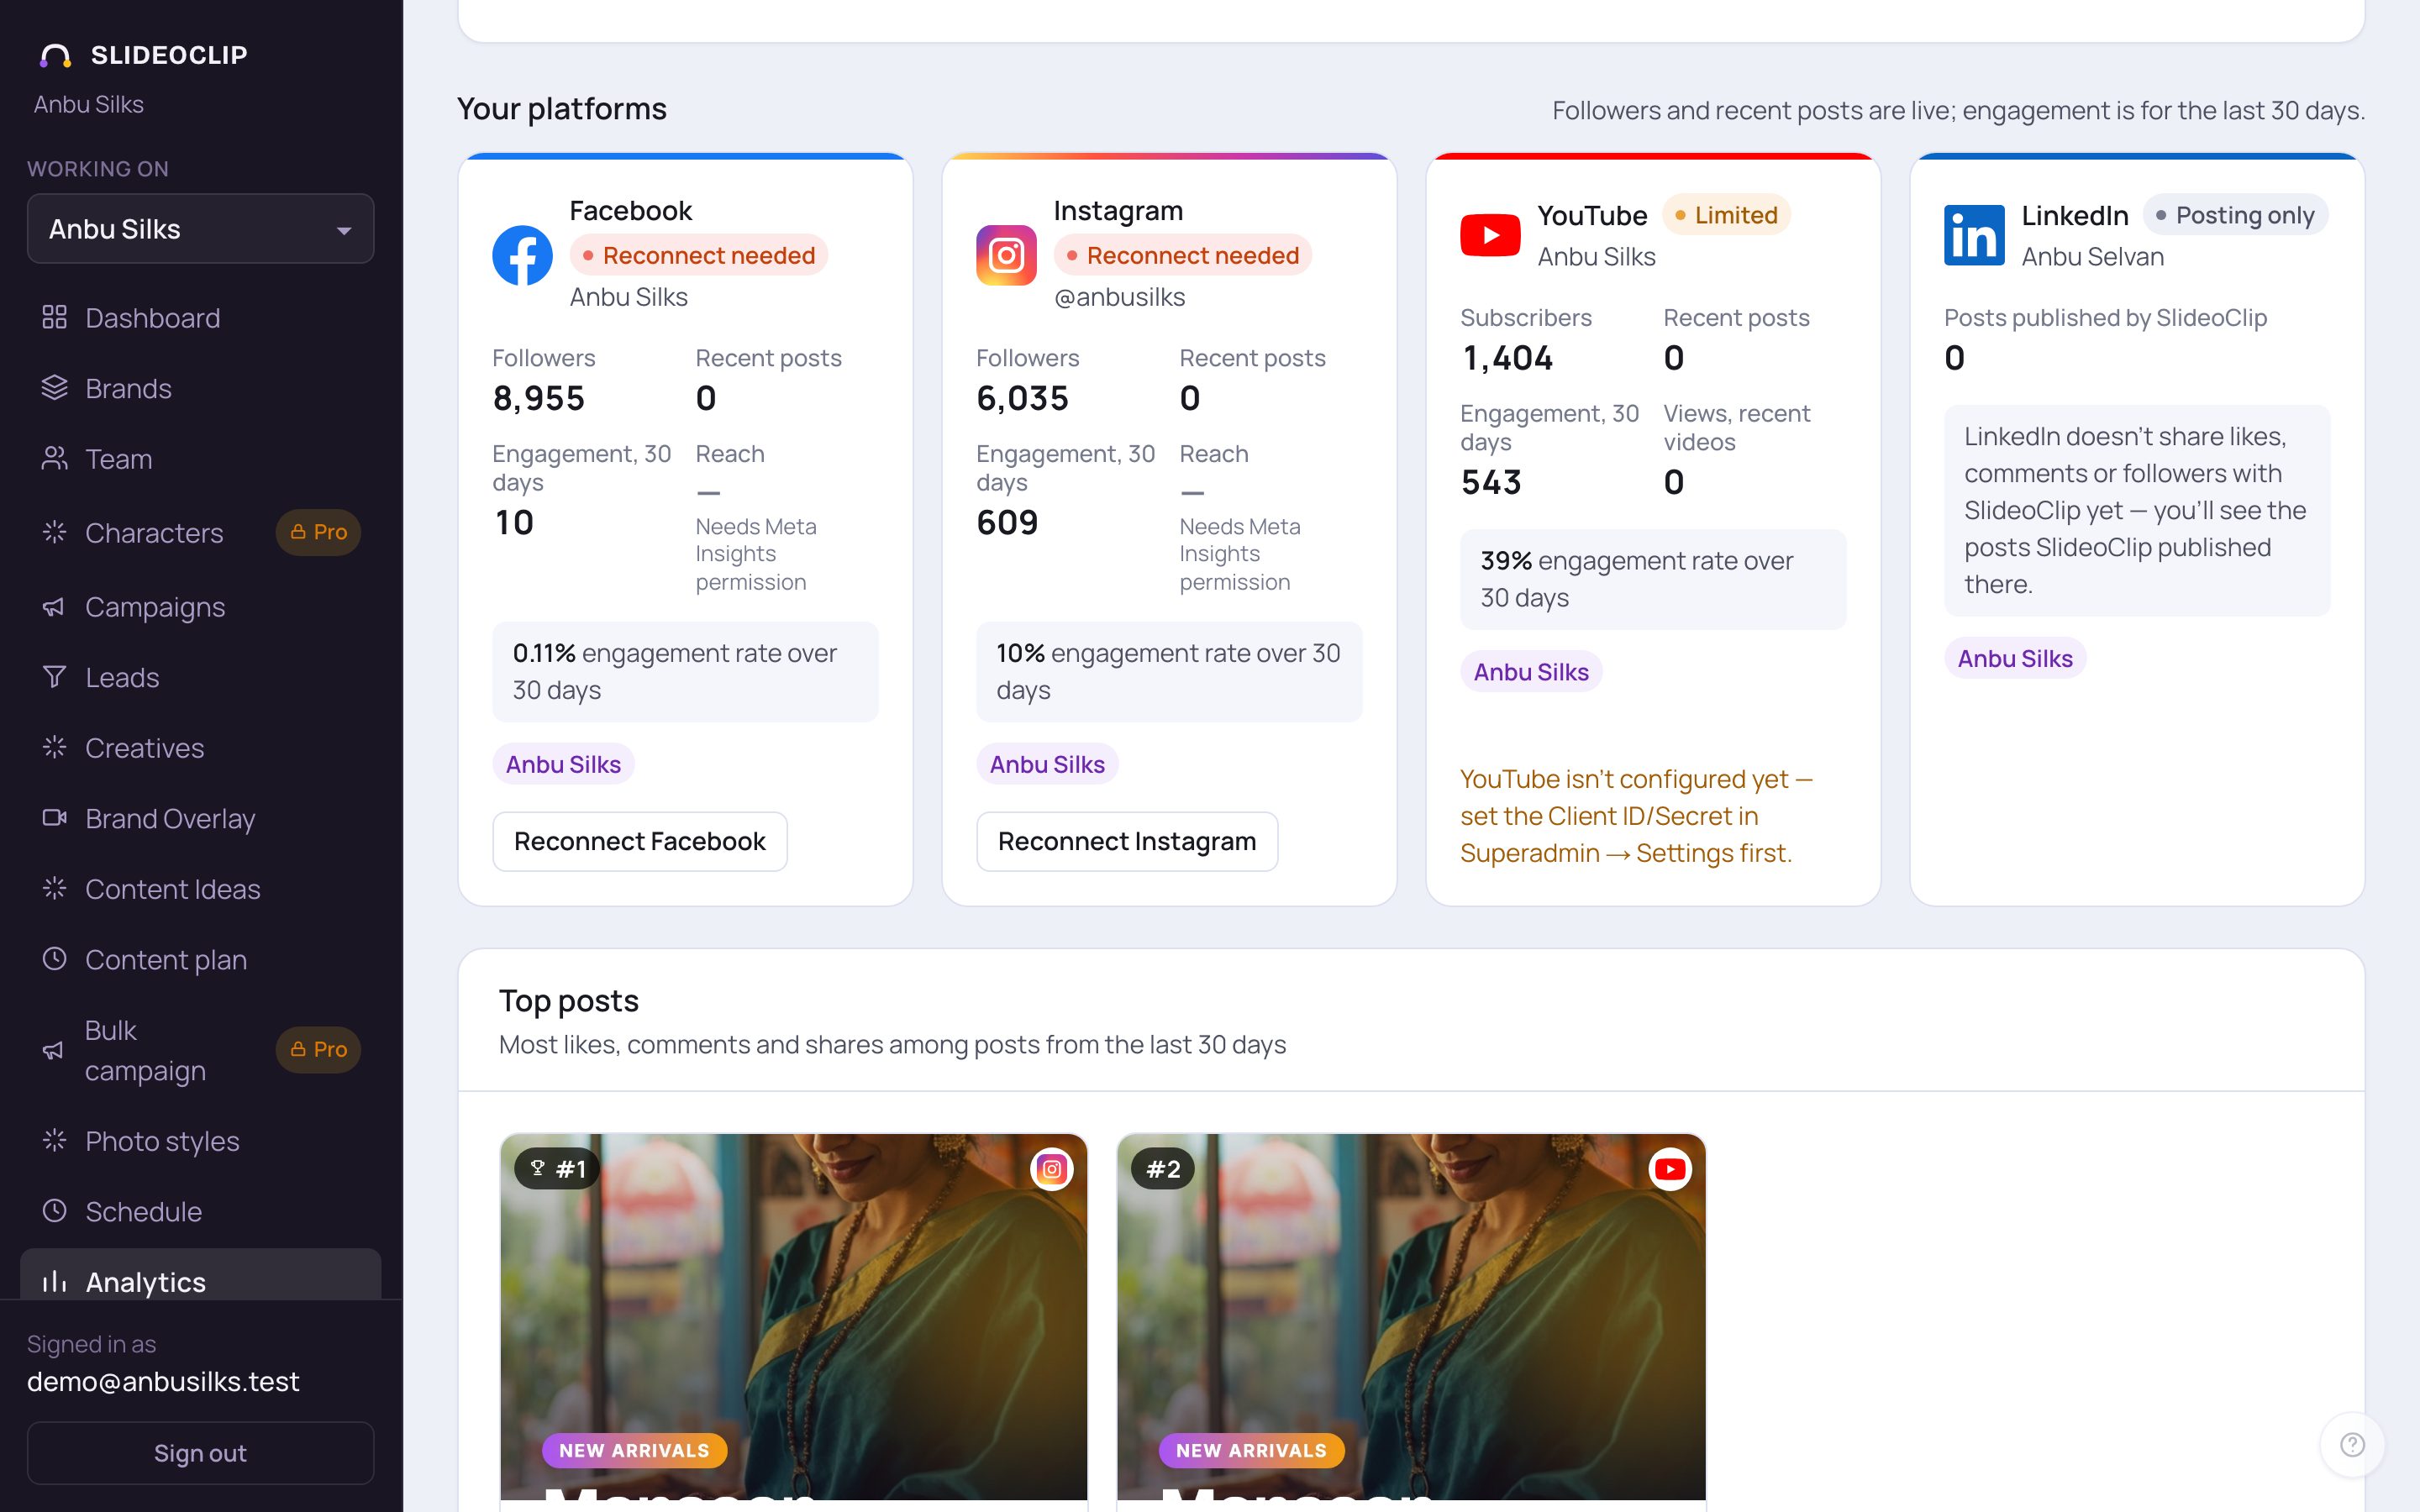
- 1Each card shows the account's name and a status: Connected, Limited, Reconnect needed, Posting only or Not connected. Then Followers, Recent posts, Engagement for the period, and the engagement rate (engagement compared with followers).
- 2Instagram: likes, comments and followers are live. Reach needs a Meta permission SlideoClip doesn't have yet, so it shows —.
- 3YouTube shows Subscribers and Views, recent videos (your latest uploads).
- 4LinkedIn doesn't share likes, comments or followers with SlideoClip yet, so its card shows Posting only and the number of posts SlideoClip published there.
- If a card says Reconnect needed, tap Reconnect … on it and log in to that platform again.
5. Your best and latest posts
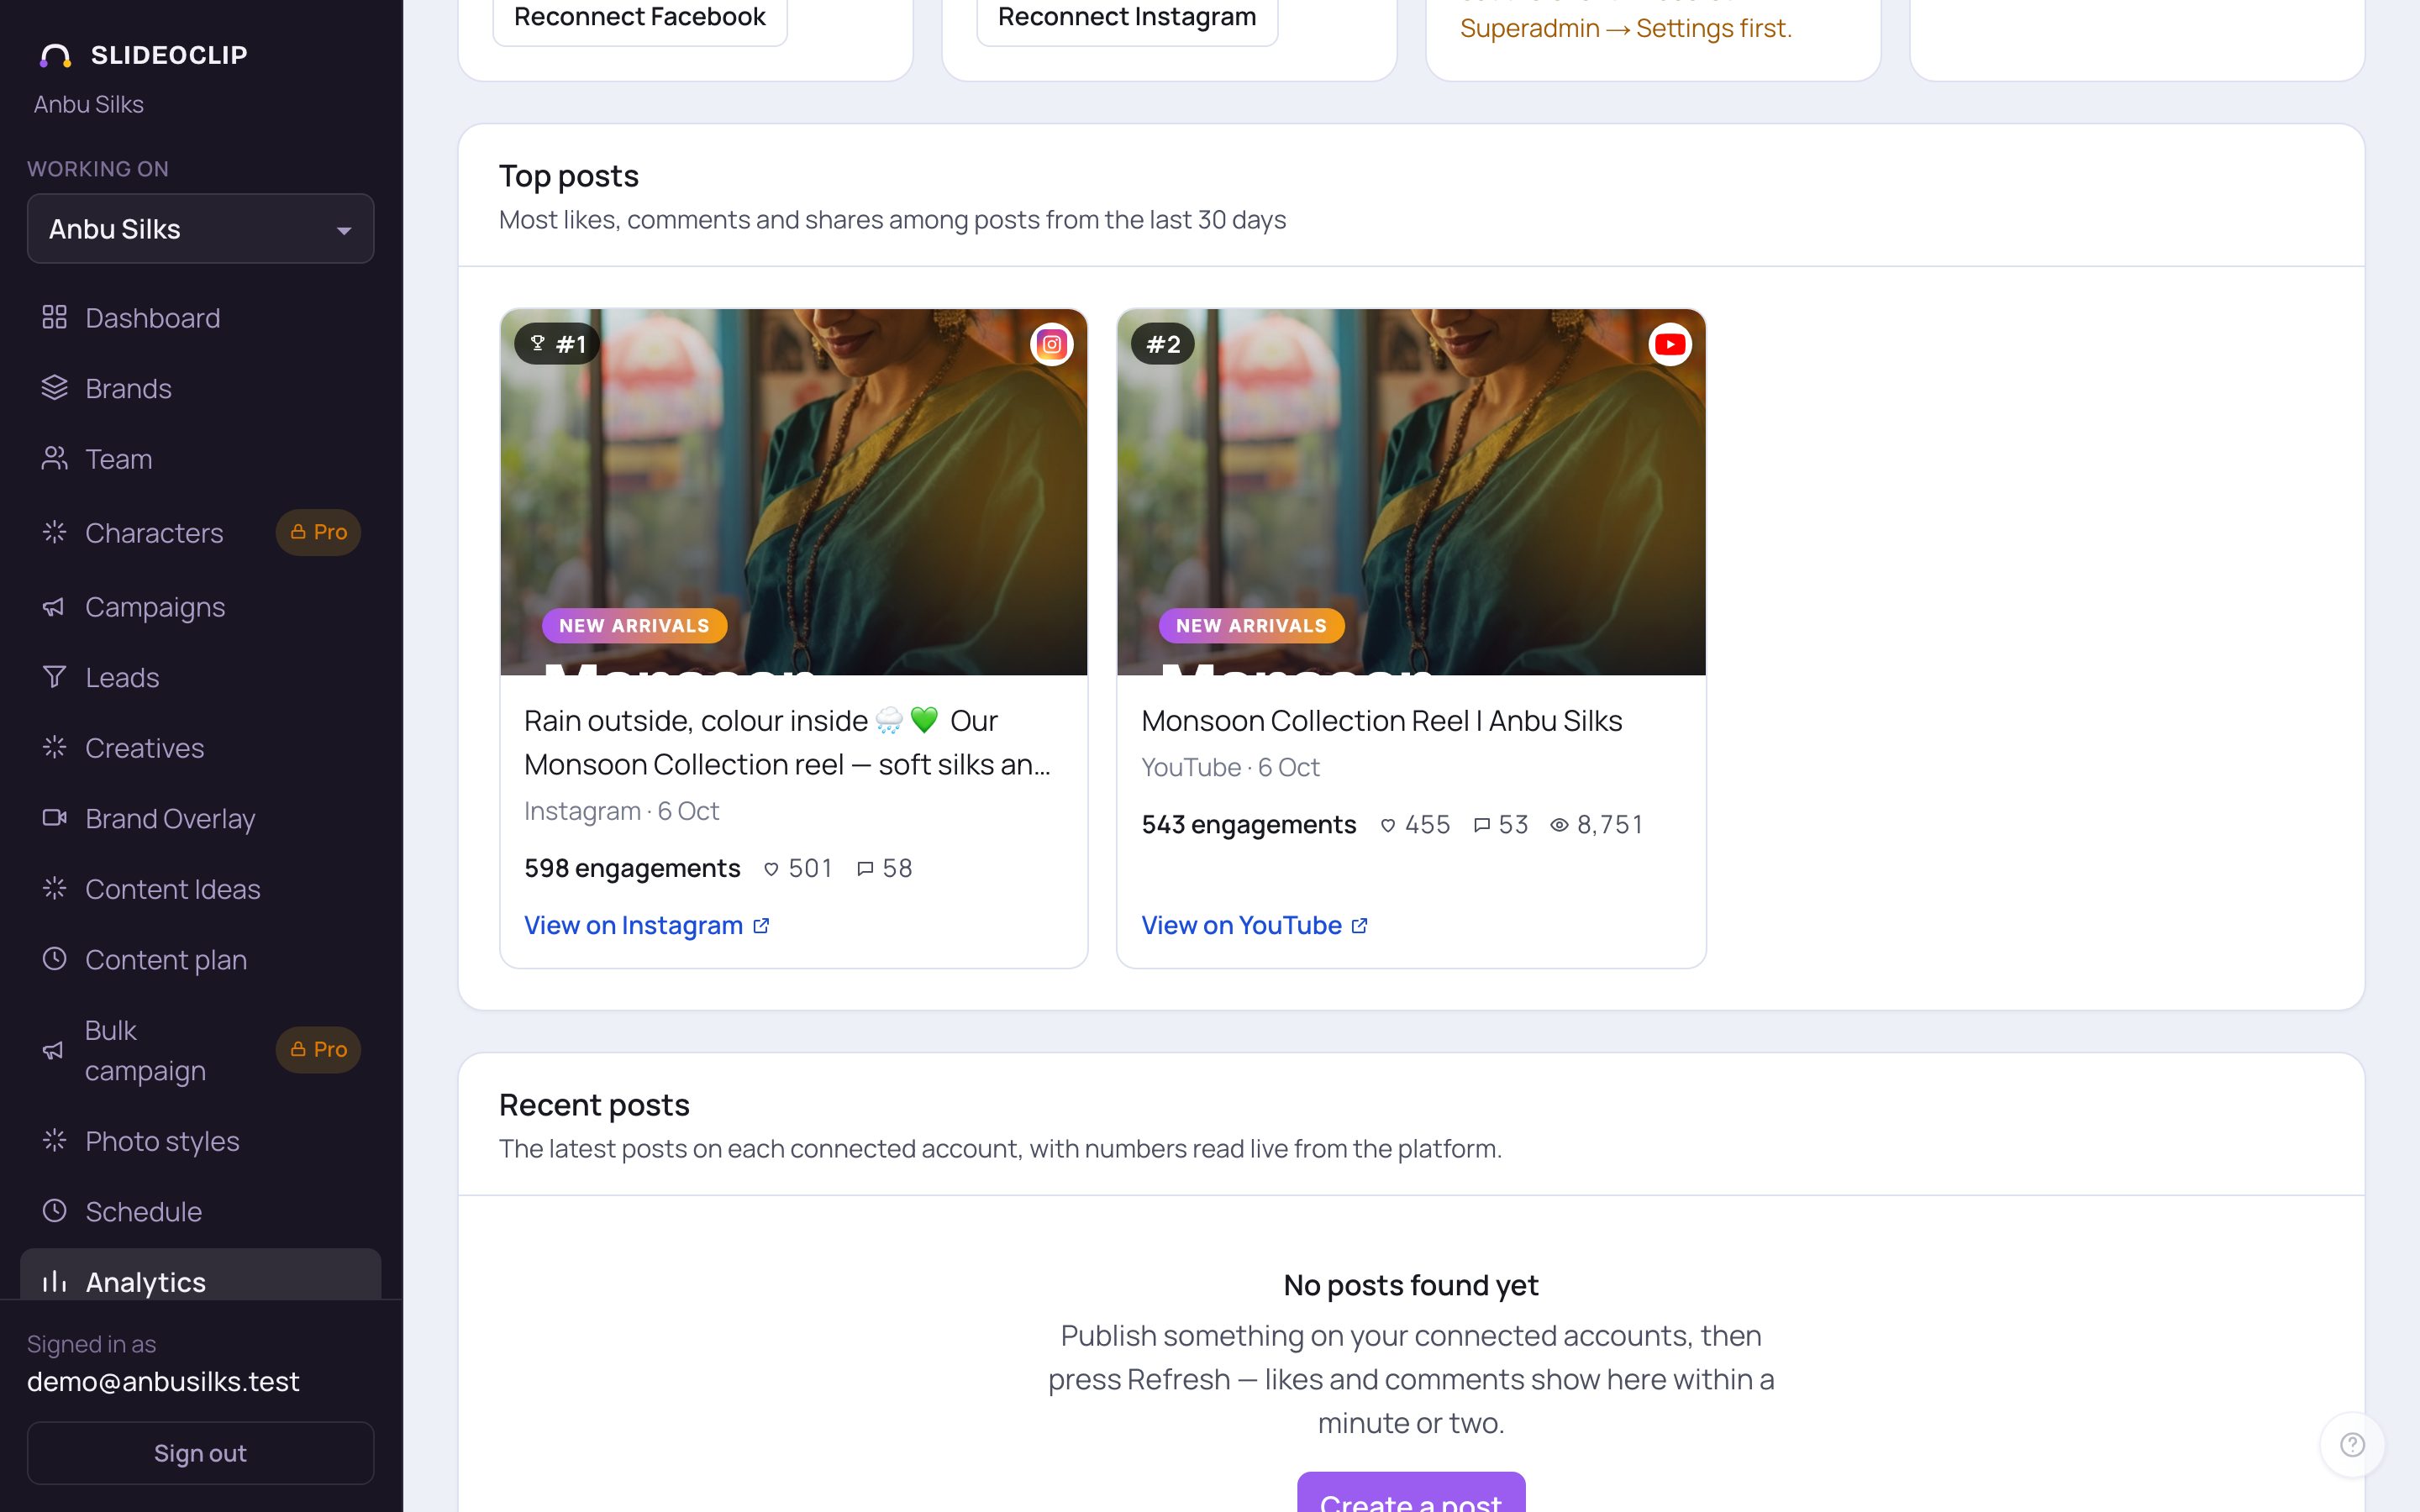
- 1Top posts: your three posts with the most likes, comments and shares in this period. Each shows its engagements, likes, comments (and views for YouTube).
- 2Tap View on … to open that post on its platform.
- Under it, Recent posts lists the latest posts on each connected account, with numbers read live from the platform: Views, Likes, Comments, Shares and Engagement, and which client it was for. It shows once your accounts have posts to read.
- There, tap All or a platform logo to see only that platform's posts (the small number is how many it has), and Sort by Newest first, Most engagement or Most views.
6. Accounts, best time to post and what the numbers can't show
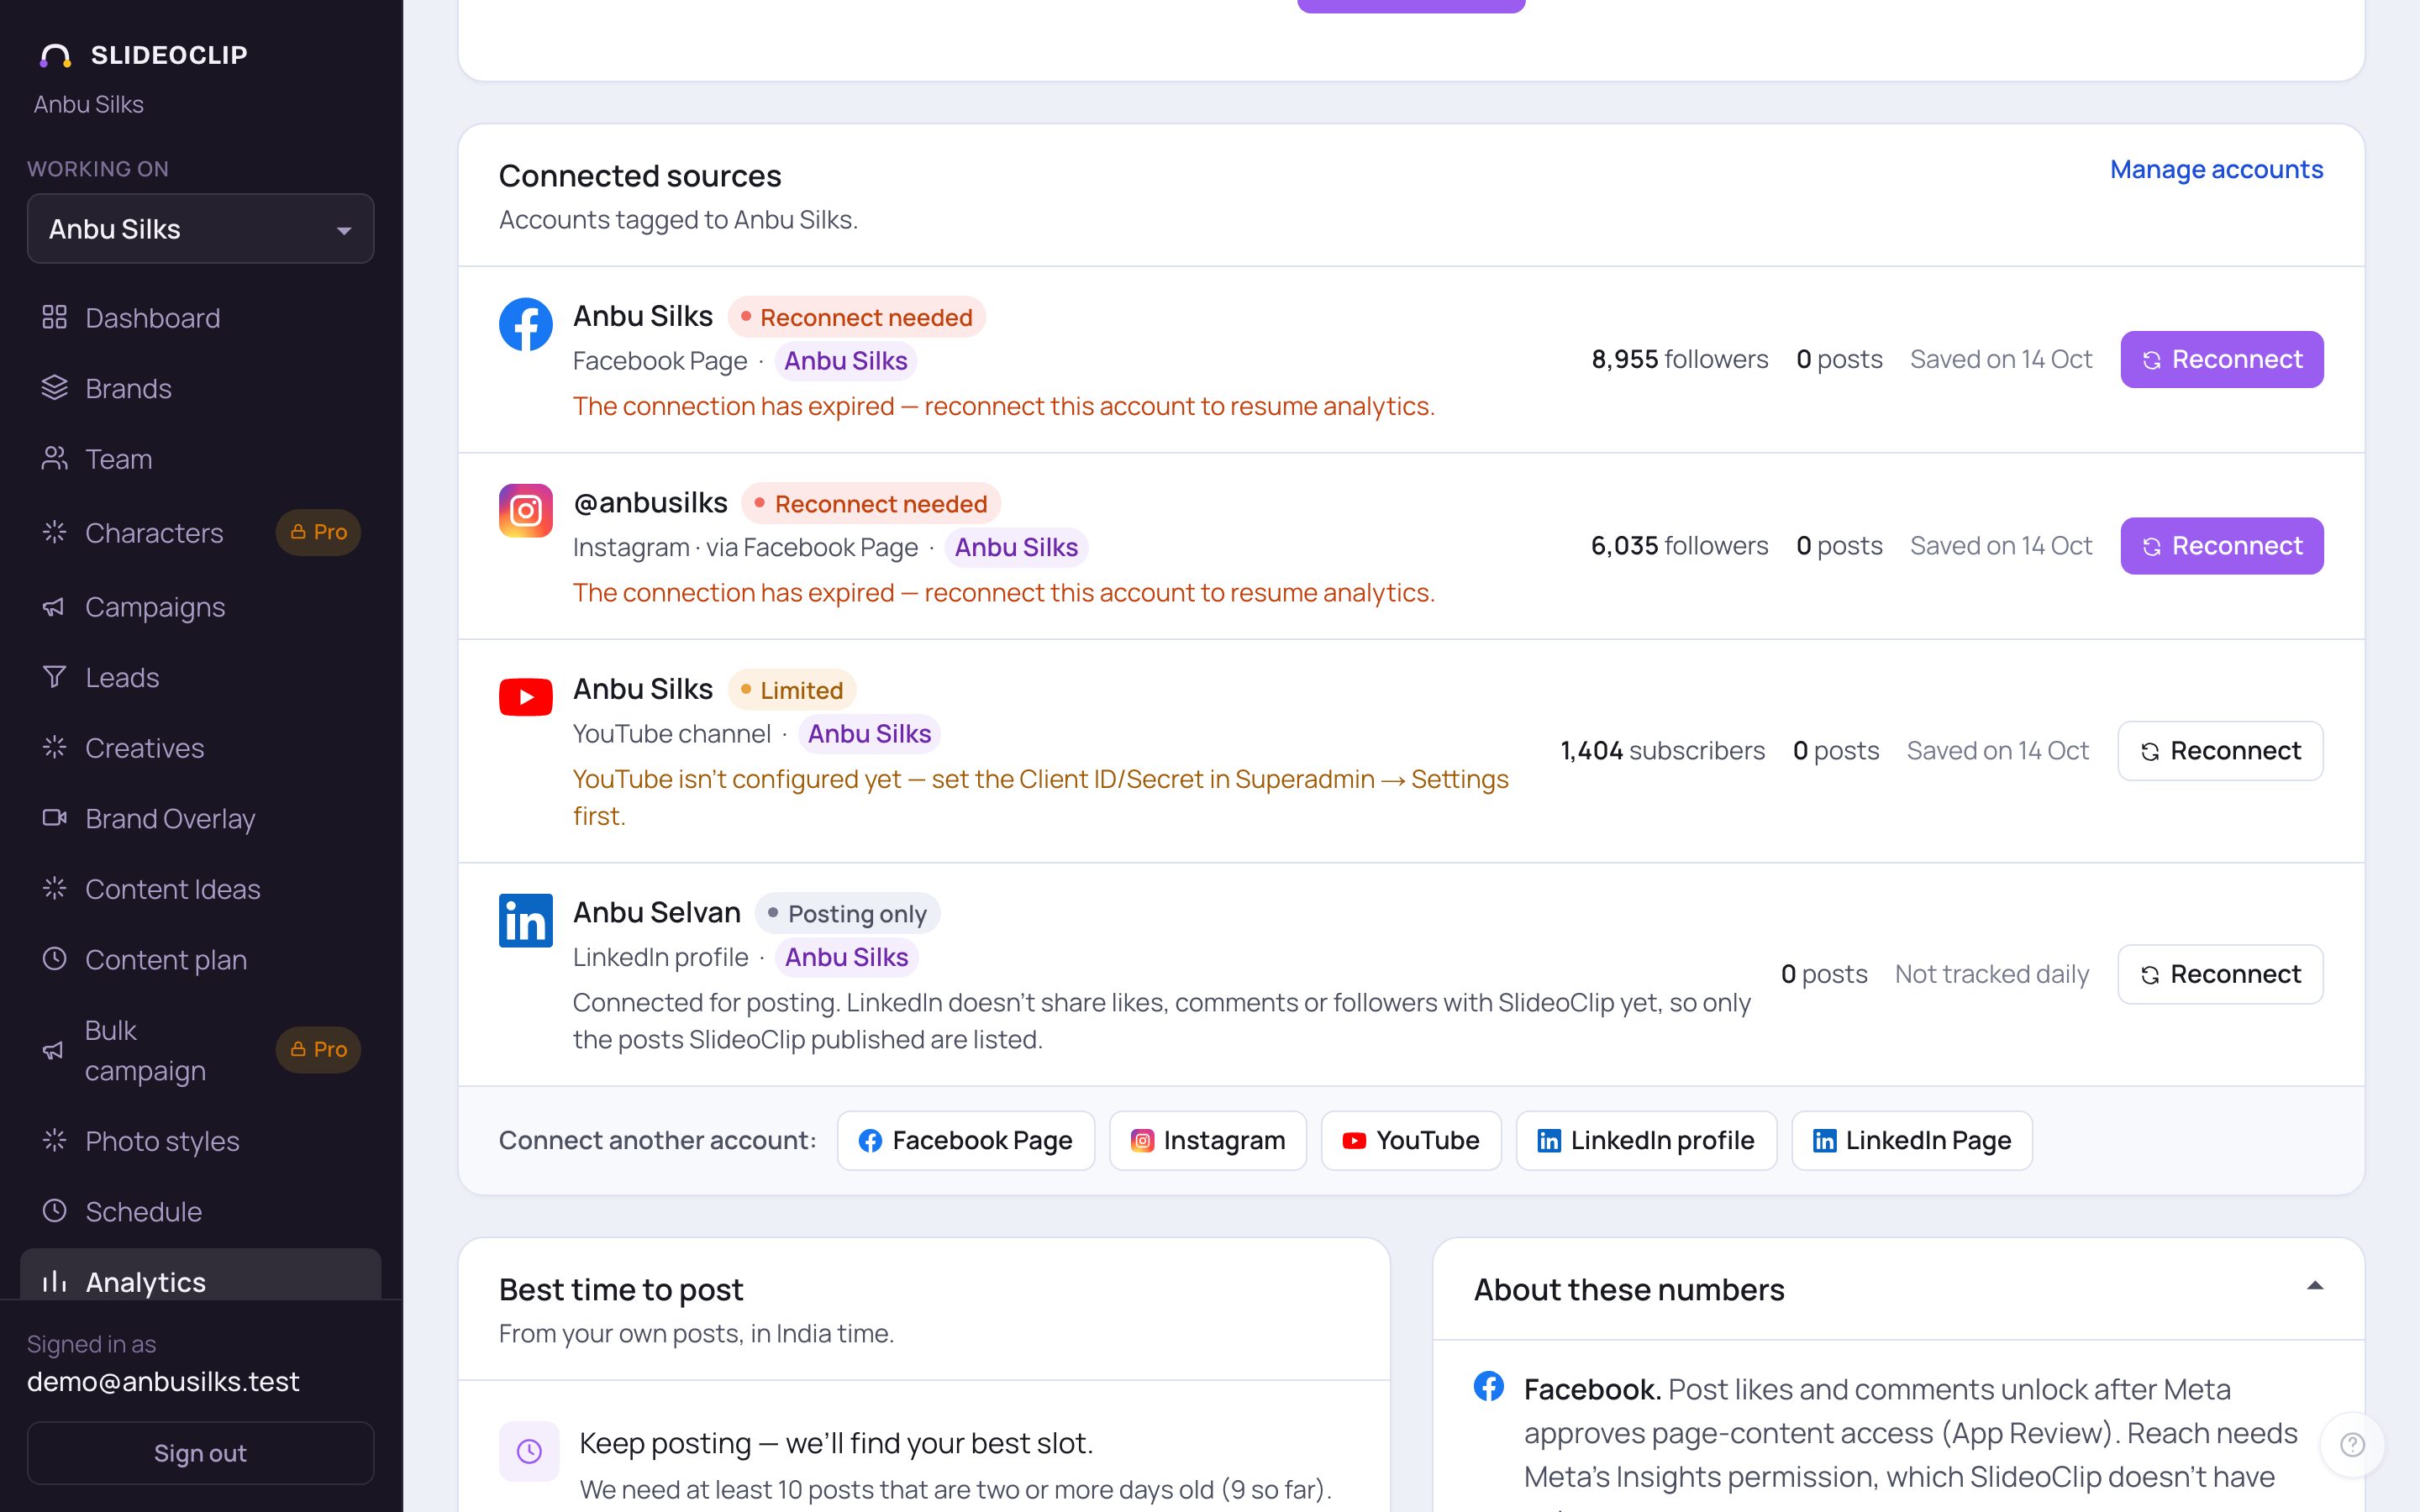
- 1Connected sources lists every account SlideoClip reads, the client it posts for, its followers, posts and when its numbers were last saved. Manage accounts opens the Dashboard to connect or tag accounts.
- 2Reconnect logs in to that account again. Use it only when the account says Reconnect needed or shows a problem; it opens the platform's own login.
- 3Best time to post: the times of day and days of the week your own posts did best, in India time. It needs a few posts that are at least two days old; until then a bar shows how many you have so far.
- 4About these numbers explains, platform by platform, which numbers each one shares with SlideoClip.
💡 Saved daily numbers are kept for 13 months.
Good to know
- Compare 30 days with the period before to see whether you're growing; 7 days is handy right after a busy week of posts.
- Look at Top posts before planning your next month: make more of what people liked.
- Post at the times shown under Best time to post. You can set that time in the content plan.
- Pick a client at the top before showing the numbers to that client, so only their accounts are counted.
Questions
Why do some numbers show —?
That platform doesn't share that number with SlideoClip yet (for example Facebook and Instagram reach, or anything on LinkedIn), or it has only just been connected. Hover over the — to see the reason. We never show a guess instead.
Why don't my Facebook post likes show?
Facebook post likes and comments unlock after Meta approves SlideoClip's access to page content. Followers and posts show already.
I just connected an account. Why are the charts empty?
The cards and charts are built from numbers saved once a day. The first save happens within a day; come back in a few days to see changes over time.
Can I send these numbers to my client?
Yes. Use the Client report page to make a printable report for one client and save it as a PDF.